Hamlin County, South Dakota
Hamlin County | |
|---|---|
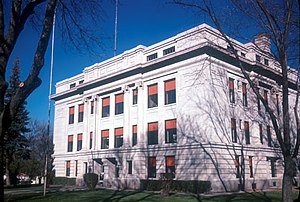
 Hamlin County Courthouse in Hayti in 1974 | |
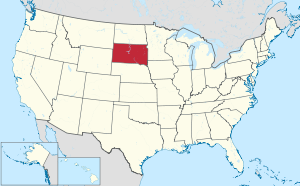
 Location within the U.S. state of South Dakota | |
 South Dakota's location within the U.S. | |
| Coordinates: 44°41′N 97°12′W / 44.68°N 97.2°W | |
| Country | |
| State | |
| Founded | 1873 (created) 1878 (organized) |
| Named for | Hannibal Hamlin |
| Seat | Hayti |
| Largest city | Estelline |
| Area | |
• Total | 538 sq mi (1,390 km2) |
| • Land | 507 sq mi (1,310 km2) |
| • Water | 31 sq mi (80 km2) 5.7% |
| Population (2020) | |
• Total | 6,164 |
• Estimate (2023) | 6,451 |
| • Density | 11/sq mi (4.4/km2) |
| Time zone | UTC−6 (Central) |
| • Summer (DST) | UTC−5 (CDT) |
| Congressional district | At-large |
| Website | https://hamlinco.us/ |
Hamlin County is a county in the U.S. state of South Dakota. As of the 2020 census, the population was 6,164.[1] Its county seat is Hayti.[2] The county was created in 1873 and organized in 1878.[3] It was named for Hannibal Hamlin, Lincoln's first vice-president.[4]
Geography
[edit]
The terrain of Hamlin County consists of low rolling hills, dotted with small lakes and ponds. The land is largely dedicated to agriculture.[5] The terrain slopes to the south-southeast, and its highest point is on the eastern boundary line, near its NE corner, at 1,949 ft (594 m) ASL.[6]
Hamlin County has a total area of 538 square miles (1,390 km2), of which 507 square miles (1,310 km2) is land and 31 square miles (80 km2) (5.7%) is water.[7]
Major highways
[edit]Adjacent counties
[edit]- Codington County - north
- Deuel County - east
- Brookings County - southeast
- Kingsbury County - southwest
- Clark County - west
Protected areas
[edit]Source:[5]
- Baxter Slough State Public Shooting Area
- Bochek State Public Shooting Area
- Eidsness State Public Shooting Area
- Hamlin State Public Shooting Area
- Harju State Public Shooting Area
- Hayes Slough State Public Shooting Area
- Johnsons Slough State Public Shooting Area
- McShane State Public Shooting Area
- Opdahl Slough State Public Shooting Area
- Rasmussen State Public Shooting Area
Lakes
[edit]Source:[5]
- Clear Lake
- Dry Lake
- Lake Albert (partial)
- Lake Marsh
- Lake Mary
- Lake Norden
- Lake Poinsett
- Lake Saint John
Demographics
[edit]| Census | Pop. | Note | %± |
|---|---|---|---|
| 1880 | 693 | — | |
| 1890 | 4,623 | 567.1% | |
| 1900 | 5,945 | 28.6% | |
| 1910 | 7,475 | 25.7% | |
| 1920 | 8,054 | 7.7% | |
| 1930 | 8,299 | 3.0% | |
| 1940 | 7,562 | −8.9% | |
| 1950 | 7,058 | −6.7% | |
| 1960 | 6,303 | −10.7% | |
| 1970 | 5,172 | −17.9% | |
| 1980 | 5,261 | 1.7% | |
| 1990 | 4,974 | −5.5% | |
| 2000 | 5,540 | 11.4% | |
| 2010 | 5,903 | 6.6% | |
| 2020 | 6,164 | 4.4% | |
| 2023 (est.) | 6,451 | [8] | 4.7% |
| U.S. Decennial Census[9] 1790-1960[10] 1900-1990[11] 1990-2000[12] 2010-2020[1] | |||
2020 census
[edit]As of the 2020 census, there were 6,164 people, 2,155 households, and 1,513 families residing in the county.[13] The population density was 12.2 inhabitants per square mile (4.7/km2). There were 2,759 housing units.
2010 census
[edit]As of the 2010 census, there were 5,903 people, 2,108 households, and 1,483 families in the county. The population density was 11.6 inhabitants per square mile (4.5/km2). There were 2,760 housing units at an average density of 5.4 units per square mile (2.1 units/km2). The racial makeup of the county was 96.7% white, 0.3% American Indian, 0.2% black or African American, 0.2% Asian, 1.8% from other races, and 0.8% from two or more races. Those of Hispanic or Latino origin made up 2.5% of the population. In terms of ancestry, 42.3% were German, 24.0% were Norwegian, 7.0% were English, 6.1% were Irish, 5.4% were Dutch, and 5.3% were American.
Of the 2,108 households, 33.2% had children under the age of 18 living with them, 61.4% were married couples living together, 5.6% had a female householder with no husband present, 29.6% were non-families, and 25.6% of all households were made up of individuals. The average household size was 2.68 and the average family size was 3.28. The median age was 36.8 years.
The median income for a household in the county was $44,439 and the median income for a family was $54,483. Males had a median income of $36,921 versus $24,645 for females. The per capita income for the county was $21,558. About 4.9% of families and 7.5% of the population were below the poverty line, including 11.5% of those under age 18 and 7.9% of those age 65 or over.
Communities
[edit]Cities
[edit]Towns
[edit]Census-designated place
[edit]Unincorporated communities
[edit]Source:[5]
Townships
[edit]- Brantford
- Castlewood
- Cleveland
- Dempster
- Dixon
- Estelline
- Florence
- Garfield
- Hamlin
- Hayti
- Norden
- Opdahl
- Oxford
Politics
[edit]Hamlin County voters have usually voted Republican. In only one national election since 1932 has the county selected the Democratic Party candidate.
| Year | Republican | Democratic | Third party(ies) | |||
|---|---|---|---|---|---|---|
| No. | % | No. | % | No. | % | |
| 2024 | 2,560 | 79.36% | 610 | 18.91% | 56 | 1.74% |
| 2020 | 2,372 | 76.94% | 647 | 20.99% | 64 | 2.08% |
| 2016 | 2,051 | 74.26% | 555 | 20.09% | 156 | 5.65% |
| 2012 | 1,803 | 64.55% | 921 | 32.98% | 69 | 2.47% |
| 2008 | 1,661 | 59.60% | 1,043 | 37.42% | 83 | 2.98% |
| 2004 | 1,946 | 64.63% | 1,015 | 33.71% | 50 | 1.66% |
| 2000 | 1,731 | 63.57% | 923 | 33.90% | 69 | 2.53% |
| 1996 | 1,352 | 49.02% | 1,101 | 39.92% | 305 | 11.06% |
| 1992 | 1,133 | 41.35% | 826 | 30.15% | 781 | 28.50% |
| 1988 | 1,380 | 52.06% | 1,258 | 47.45% | 13 | 0.49% |
| 1984 | 1,782 | 64.54% | 963 | 34.88% | 16 | 0.58% |
| 1980 | 1,885 | 62.69% | 903 | 30.03% | 219 | 7.28% |
| 1976 | 1,452 | 50.66% | 1,402 | 48.92% | 12 | 0.42% |
| 1972 | 1,693 | 56.85% | 1,276 | 42.85% | 9 | 0.30% |
| 1968 | 1,649 | 56.36% | 1,149 | 39.27% | 128 | 4.37% |
| 1964 | 1,525 | 49.42% | 1,561 | 50.58% | 0 | 0.00% |
| 1960 | 2,139 | 63.49% | 1,230 | 36.51% | 0 | 0.00% |
| 1956 | 2,083 | 61.68% | 1,294 | 38.32% | 0 | 0.00% |
| 1952 | 2,391 | 71.48% | 954 | 28.52% | 0 | 0.00% |
| 1948 | 1,608 | 53.98% | 1,326 | 44.51% | 45 | 1.51% |
| 1944 | 1,811 | 63.97% | 1,020 | 36.03% | 0 | 0.00% |
| 1940 | 2,279 | 64.00% | 1,282 | 36.00% | 0 | 0.00% |
| 1936 | 1,857 | 52.25% | 1,622 | 45.64% | 75 | 2.11% |
| 1932 | 1,267 | 39.23% | 1,920 | 59.44% | 43 | 1.33% |
| 1928 | 1,959 | 63.19% | 1,088 | 35.10% | 53 | 1.71% |
| 1924 | 1,144 | 52.38% | 207 | 9.48% | 833 | 38.14% |
| 1920 | 1,322 | 63.68% | 337 | 16.23% | 417 | 20.09% |
| 1916 | 1,039 | 57.82% | 692 | 38.51% | 66 | 3.67% |
| 1912 | 0 | 0.00% | 474 | 29.92% | 1,110 | 70.08% |
| 1908 | 1,095 | 68.57% | 434 | 27.18% | 68 | 4.26% |
| 1904 | 1,197 | 75.76% | 307 | 19.43% | 76 | 4.81% |
| 1900 | 928 | 62.79% | 509 | 34.44% | 41 | 2.77% |
| 1896 | 702 | 55.10% | 559 | 43.88% | 13 | 1.02% |
| 1892 | 537 | 50.80% | 161 | 15.23% | 359 | 33.96% |
Notable people
[edit]- Nicholas Egbert Knight (1866–1946), politician
- Kristi Noem, Governor of South Dakota
See also
[edit]References
[edit]- ^ a b "State & County QuickFacts". United States Census Bureau. Retrieved March 21, 2024.
- ^ "Find a County". National Association of Counties. Retrieved June 7, 2011.
- ^ "Dakota Territory, South Dakota, and North Dakota: Individual County Chronologies". Dakota Territory Atlas of Historical County Boundaries. The Newberry Library. 2006. Archived from the original on April 2, 2018. Retrieved March 29, 2015.
- ^ Gannett, Henry (1905). The Origin of Certain Place Names in the United States. Govt. Print. Off. p. 148.
- ^ a b c d "Hamlin County · South Dakota". Google Maps. Retrieved April 27, 2024.
- ^ ""Find an Altitude" Google Maps (accessed February 3, 2019)". Archived from the original on May 21, 2019. Retrieved February 3, 2019.
- ^ "2010 Census Gazetteer Files". United States Census Bureau. August 22, 2012. Retrieved March 26, 2015.
- ^ "County Population Totals and Components of Change: 2020-2023". Retrieved March 17, 2024.
- ^ "U.S. Decennial Census". United States Census Bureau. Retrieved March 26, 2015.
- ^ "Historical Census Browser". University of Virginia Library. Retrieved March 26, 2015.
- ^ Forstall, Richard L., ed. (March 27, 1995). "Population of Counties by Decennial Census: 1900 to 1990". US Census Bureau. Retrieved March 26, 2015.
- ^ "Census 2000 PHC-T-4. Ranking Tables for Counties: 1990 and 2000" (PDF). United States Census Bureau. April 2, 2001. Archived (PDF) from the original on October 9, 2022. Retrieved March 26, 2015.
- ^ "US Census Bureau, Table P16: Household Type". United States Census Bureau. Retrieved March 21, 2024.
- ^ Leip, David. "Atlas of US Presidential Elections". uselectionatlas.org. Retrieved April 15, 2018.

